- The graph shows the correlation between blood glucose and liver glycogen concentrations in animals after receiving different glucose meals.
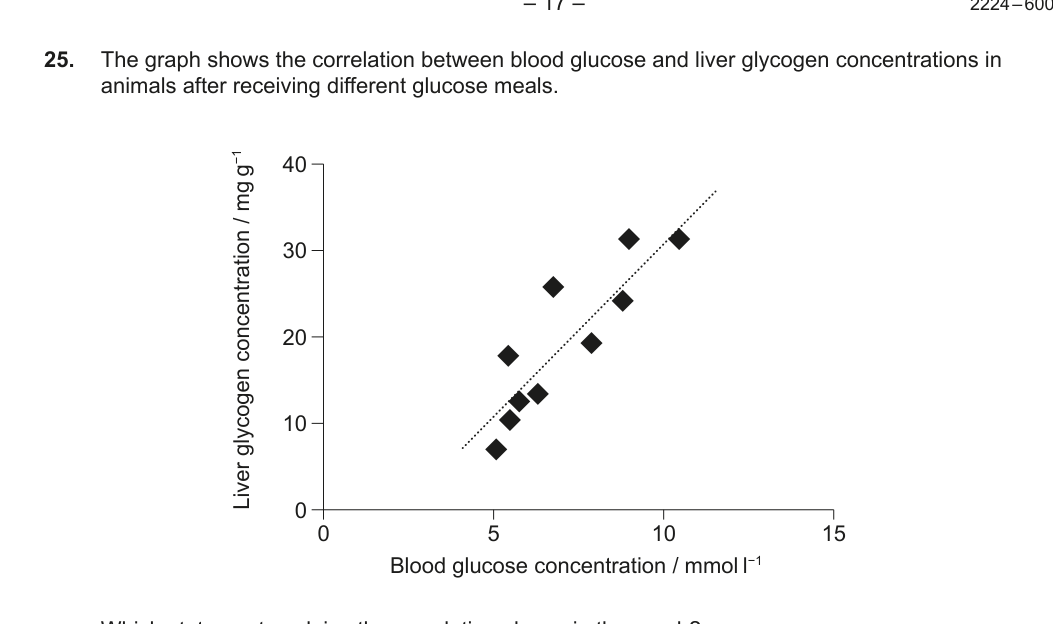
Which statement explains the correlation shown in the graph?
Biology HL Paper 1 (May 2024, TZ2)
Which statement explains the correlation shown in the graph?