- The graph shows the effect of increasing light intensity on the rate of photosynthesis during an experiment carried out at optimum temperature and normal atmospheric CO₂ concentration.
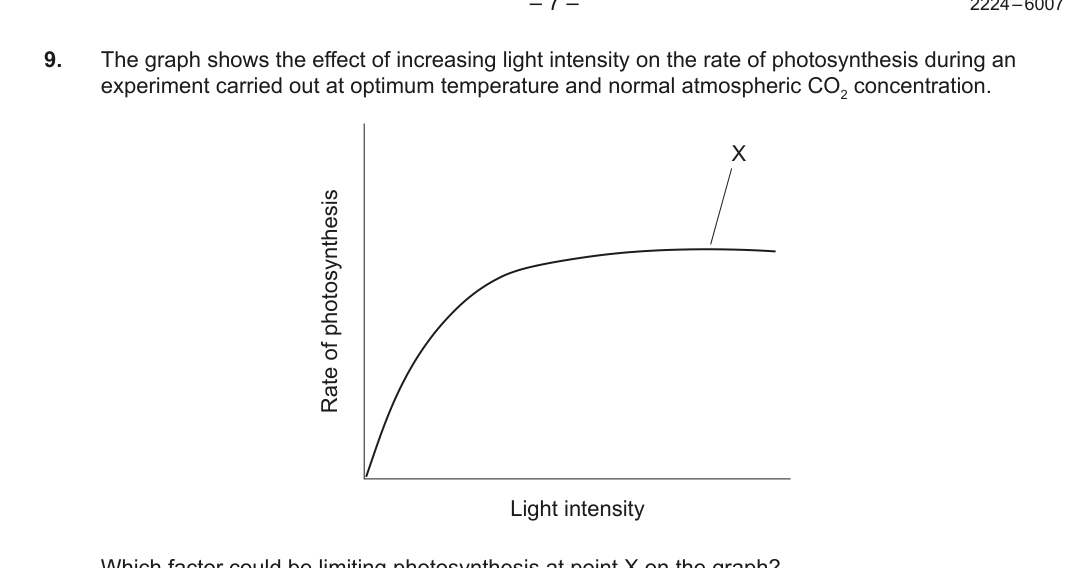
Which factor could be limiting photosynthesis at point X on the graph?